
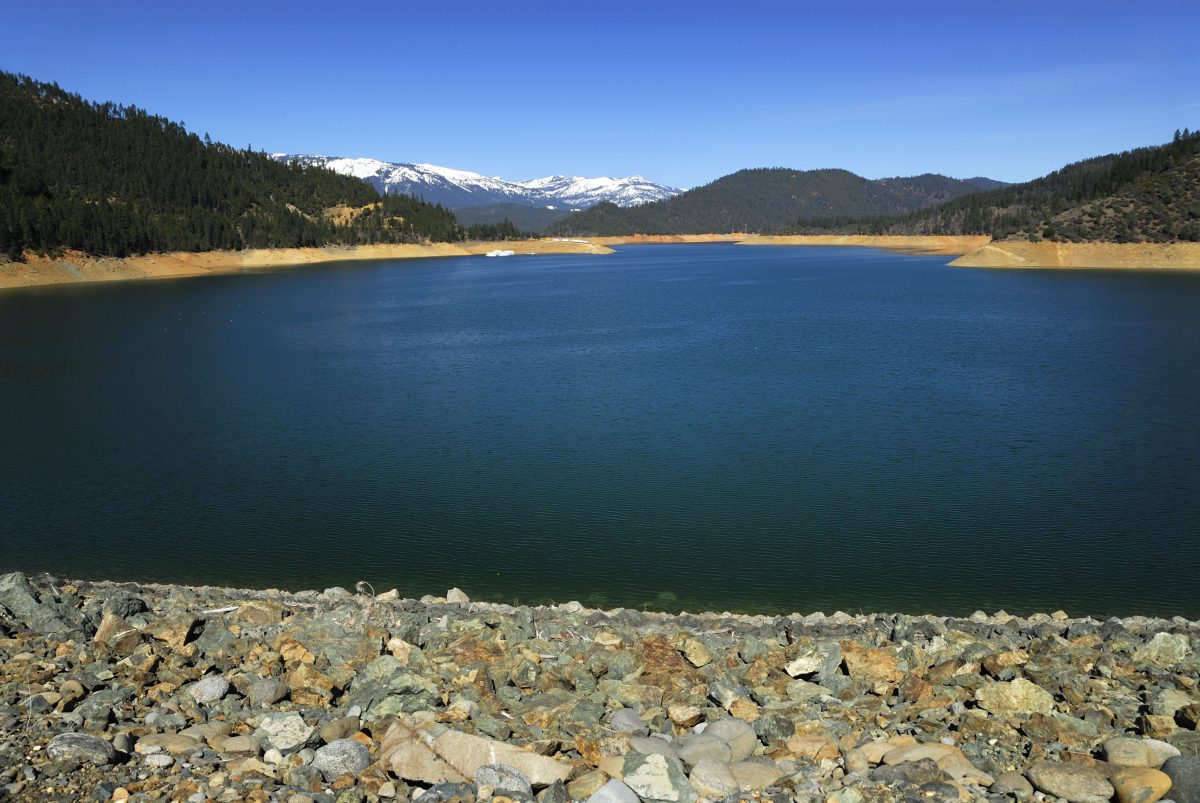
Trinity Lake, an artificial lake on the Trinity River formed by the Trinity Dam, is one of the largest reservoirs in California. The dam was built by the U.S. Bureau of Reclamation in 1960 to capture and store water for the Central Valley Project, which provides the Central Valley with water for irrigation and produces hydroelectric power. Even though the dam blocks fish passage to the river, Trinity Lake is still home to a self-sustaining population of land-locked salmon.
A graph of Trinity Lake Elevations over time is at the bottom of this page. Click here for current conditions at Trinity Lake (inflow, outflow, reservoir storage, and lake level). Central Valley Operations (CVO) now provides a weekly report for the Trinity Journal on their website.
Inflows
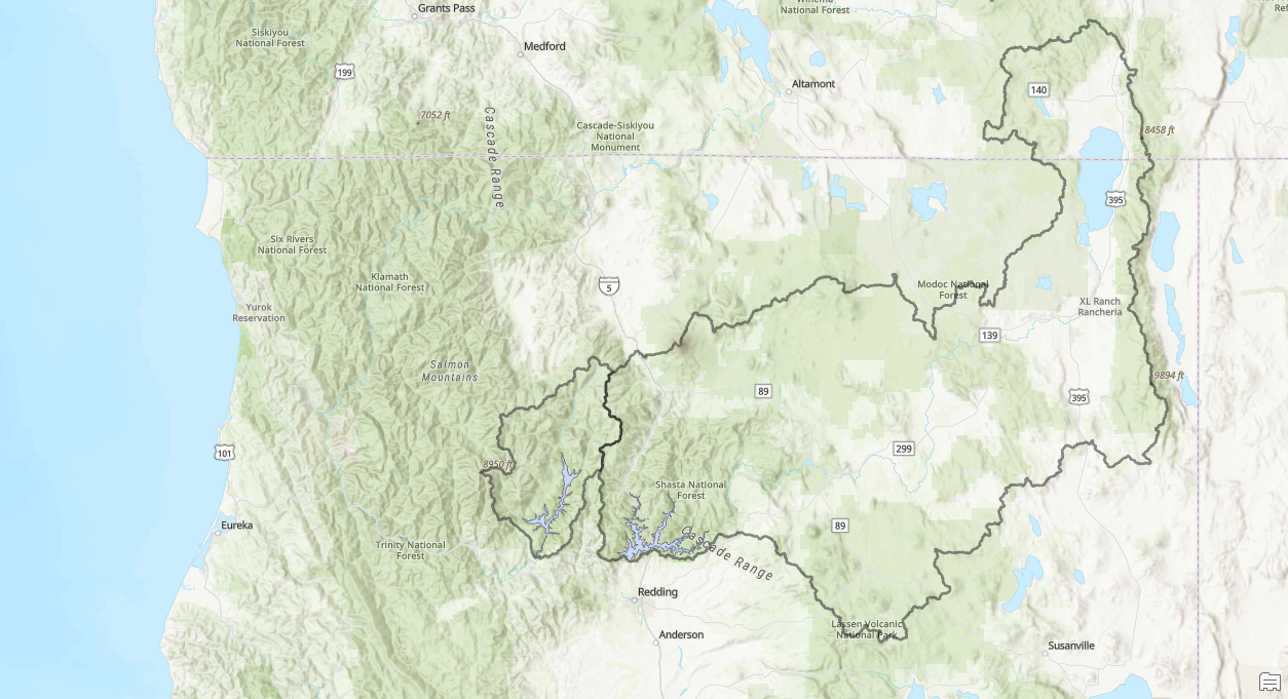
Trinity Lake is a relatively large reservoir compared to the watershed that supplies it (watershed map). Much of the water initially falls as snow in the surrounding mountains (including the Trinity Alps), which may not melt and flow to the reservoir until late spring or even summer. For this reason, Trinity is slow to fill relative to many other California reservoirs. The table below is a comparison of inflow to Trinity Lake versus several other major reservoirs.
| Reservoir | Storage (af) | Average Annual Inflow (af) | Months to Fill at Average Inflow Rate |
| Trinity Lake | 2,448,000 | 1,320,000 | 22.3 |
| Shasta Lake | 4,552,000 | 5,630,000 | 9.7 |
| Lake Oroville | 3,500,000 | 4,330,000 | 9.7 |
| Folsom Lake | 977,000 | 2,680,000 | 4.4 |
Outflows
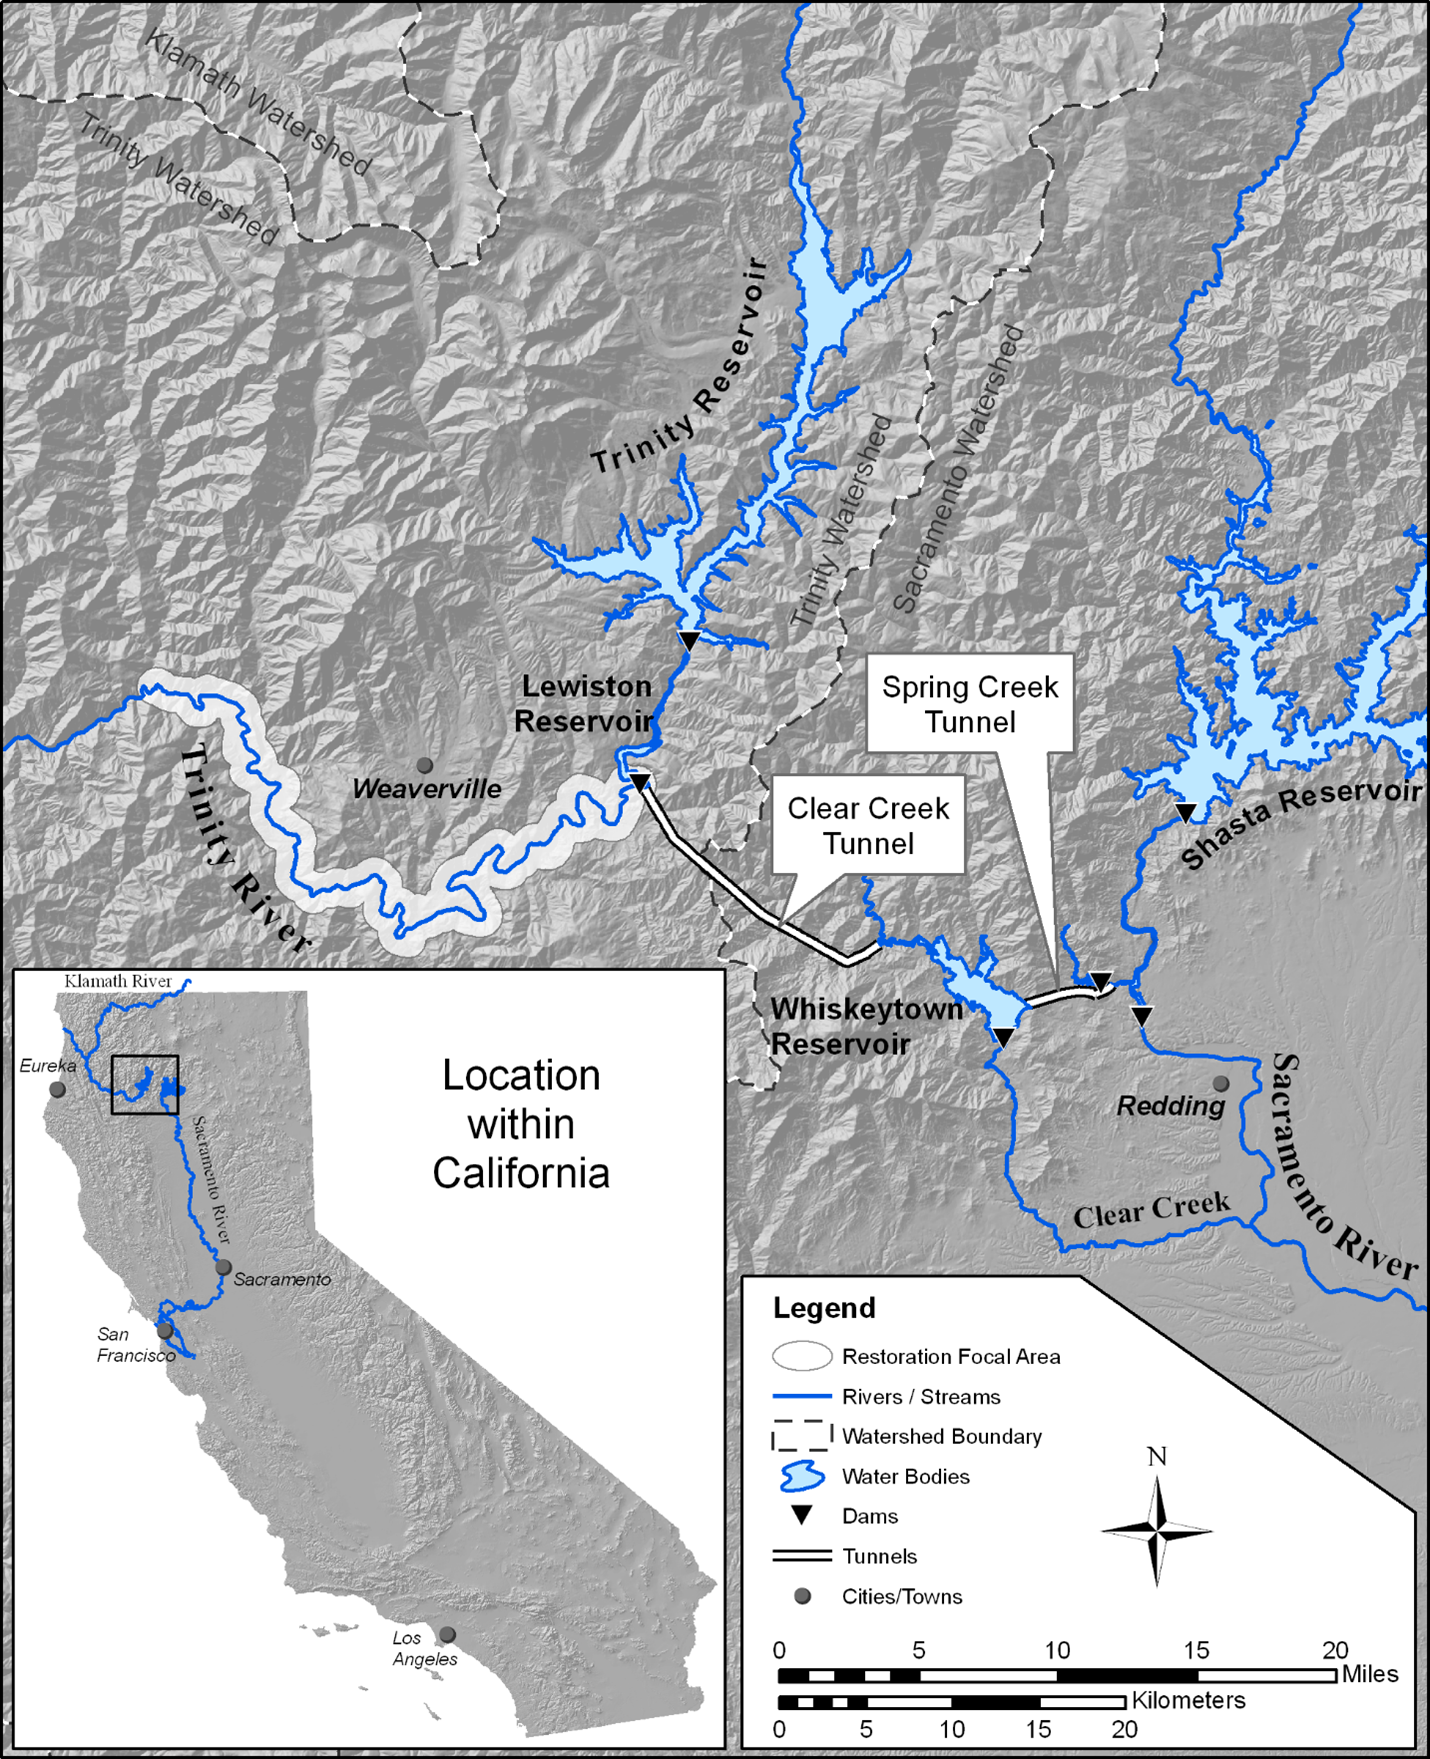
Water stored in Trinity Lake is released to Lewiston Lake, where it can either be released to the river or exported through the Clear Creek Tunnels to the Judge Francis Carr Powerhouse and Whiskeytown Lake (map below). Whiskeytown Lake is managed to maintain a relatively constant surface elevation while water passes through, so the flow of water through the reservoir is difficult to see.. From there water can go either through Whiskeytown Dam to Clear Creek and the Sacramento River, or through the Spring Creek Tunnels to Keswick Reservoir, located higher on the Sacramento River. According to USBR data, during the first 10 years of full operation (water years 1964-1973), the Trinity and Lewiston Lakes released a total of 13.86 million acre-feet of water, 12.32 million of which flowed through the Carr Powerhouse into Whiskeytown lake, resulting in an export rate of 89%.
Ecological problems began to develop within the Trinity River below the dams soon after water storage began (e.g. dense vegetation encroaching on the lower banks of the river visible in aerial photography from 1965). To alleviate these problems, water diversion to the CVP has reduced over the decades so that releases to the river could increase. With implementation of the ROD in 2000, releases now approximate a 50/50 split (averaged over multiple years) between water released to the river versus water diverted to the CVP. Read more about the need to restore the river here.
Water releases to the river have increased over the decades. However, a reservoir cannot release more water than it stores, so diversions to the Central Valley have decreased. River restoration releases (ROD volumes) are scaled to expected yearly inflows, while diversions have generally been greater in drier years. As a result, summer lake levels appear to be driven more by diversion timing than by restoration flows, even though they are less visible to the public (analysis report here).
Stuart Fork = 2335.6 ft
Pinewood Cove = 2324.2 ft
Tannery Gulch = 2323.7 ft
Bowerman = 2319.5 ft
Clarke Springs = 2317.7 ft
Fairview = 2309.5 ft
Trinity Center = 2291.9 ft
Cedar Stock = 2238.3 ft
RESTORATION FLOW PAGES