
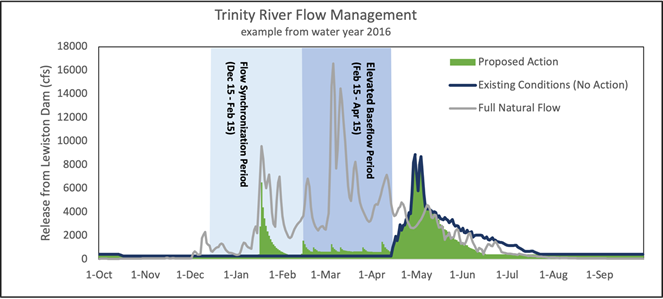
Figure 1: The Proposed Action Compared to Existing Conditions (No Action), Using the 2016 Wet Water Year as an Example.
The blue line represents the hydrograph that was implemented in 2016. Green represents the timing of hypothetical water releases that could occur under the Proposed Action. Grey line represents the full natural flow. The full natural flow is the unimpeded contributions from the blocked watershed area above Lewiston Dam. It shows the timing of when water would have naturally been contributed to Trinity River if not impounded by Trinity Lake.