
February Forecast
Water Year ’26 thus far has been a rain driven year for storage in Trinity Reservoir. Current storage is a product of early season rain plus elevated levels at beginning of the water year.
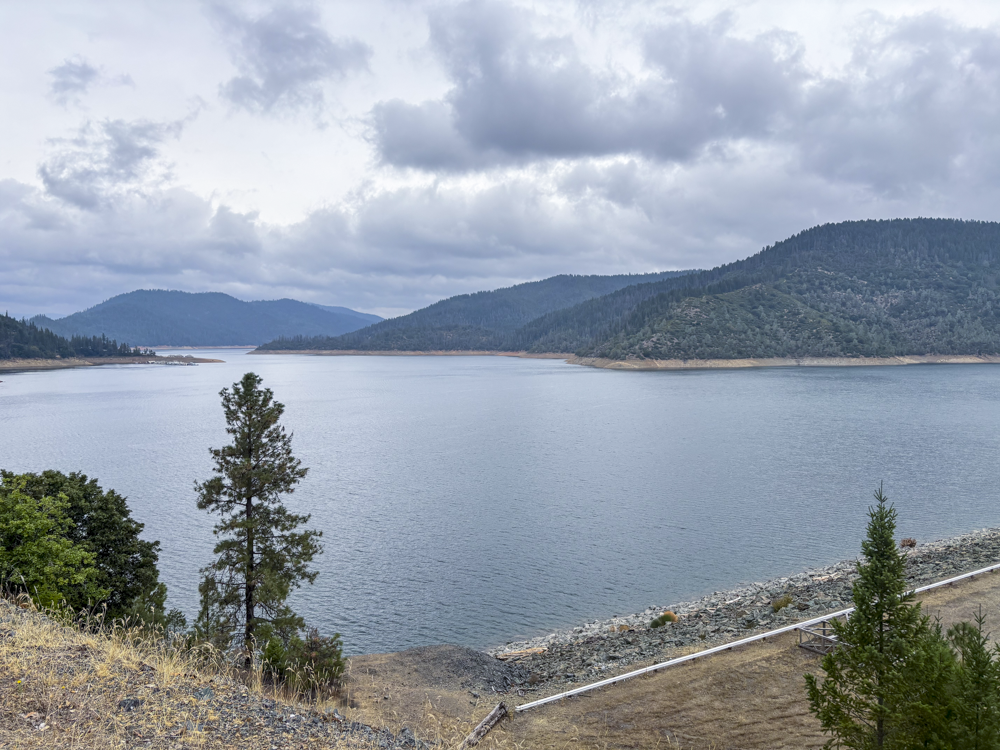
In October, Trinity measured in at 70% full with 1.7 million acre feet. Seasonal storms pushed storage over 2 million acre feet (or 84%) in early January leading reservoir managers to implement reservoir management releases after a synchronized storm pulse flow was paired with a post-December 15 storm. By the end of January a lack of rain and snow returned releases to winter baseflow (300 cfs).
Trinity Reservoir Daily Data (CDEC) – click the link for daily data
- Storage on [Feb. 13, 2026]: 2,050,645 AF
- Capacity: 84%
- Historic 15 Year Average (for this date): 131%
- Average storage for [Feb. 12]: 1,601,065 AF
Feb. Forecast – California-Nevada River Forecast Center
February’s long range weather forecast is thus far looking a bit more wet than late January.
The volume of environmental flow releases for the Trinity River Restoration Program’s Wet-Season Baseflow Period (Feb. 15-Apr. 14) are determined by a conservative monthly inflow projection for Trinity Reservoir from the California Department of Water Resources (90% B120) in February, March with the final determination in April.
Prior to the official determination, which is published around the 10th of the month, water managers follow the California-Nevada River Forecast Center Median forecast for Trinity Lake inflow to stay abreast of the water year projections thus far.
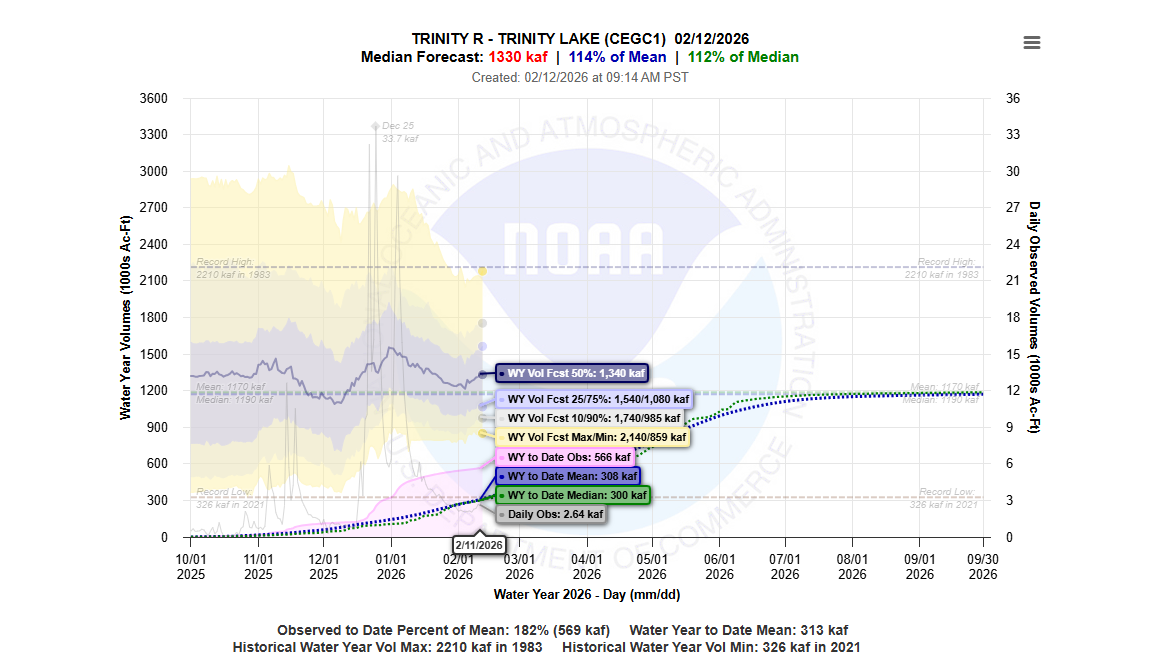
The graph (shown in screen shot above) can be a little daunting to read, but when armed with the appropriate information is discernable for any viewer.
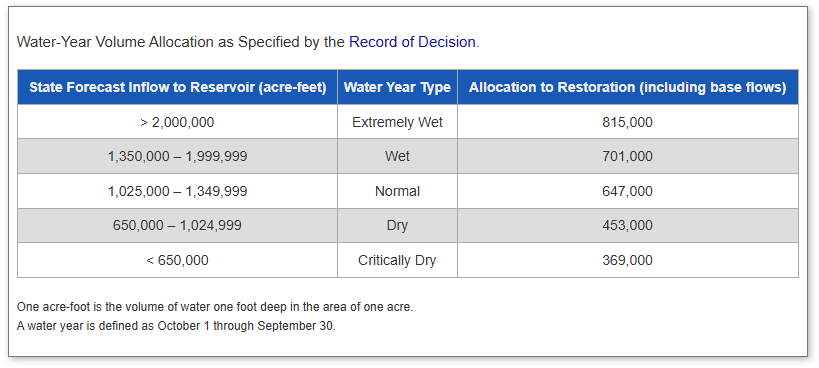
The Program’s Water-Year Volume Allocation as specified by the Record of Decision is outlined in the table below. The far left column is the threshold amount of state forecasted inflow in the Trinity Reservoir listed in acre feet which determines the center column, water year type. Then in the right column is listed the allocation to restoration for that water year, which includes baseflows.
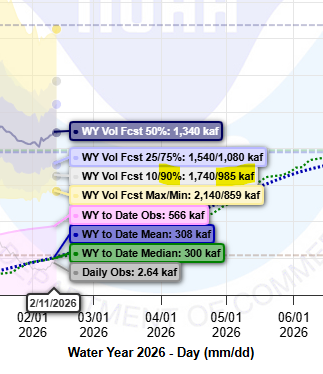
Return now to an enlargement of the CNRFC forecast screenshot from Feb 13. Check out the light grey box “WY Vol Fcst 10/90%: 1,740/985 kaf” which reads longform as the following;
As of Feb. 11, the 10% of probability for Trinity Lake Inflow is predicted as 1,740,000 acre feet and the 90% of probability is 985,000 acre feet. Translated there is a 10% probability that the Trinity Allocation is predicted as “Wet” and a 90% probability as “Dry”.
As managers track the predicted inflow via CNRFC, the Program’s Flow Workgroup develops hydrograph scenarios to use when the final determination is published by the California Department of Water Resources. The two agencies use different methods when it comes to these prediction tools, the California Department of Water Resources uses data that has a weighted average to compute statewide Snow Water Equivalent (SWE) and is known as a more conservative forecast method when comparing the two.
Wet-Season Baseflow Period (Feb. 15 – Apr. 14)
The next period within the Trinity River Restoration Program environmental flow management is the Wet-Season Baseflow Period, which initiates Feb. 15. The California Department of Water Resources February 90% B120 declaration was published on Feb. 9 as “dry” with the 90% determination at 735,000 acre feet.
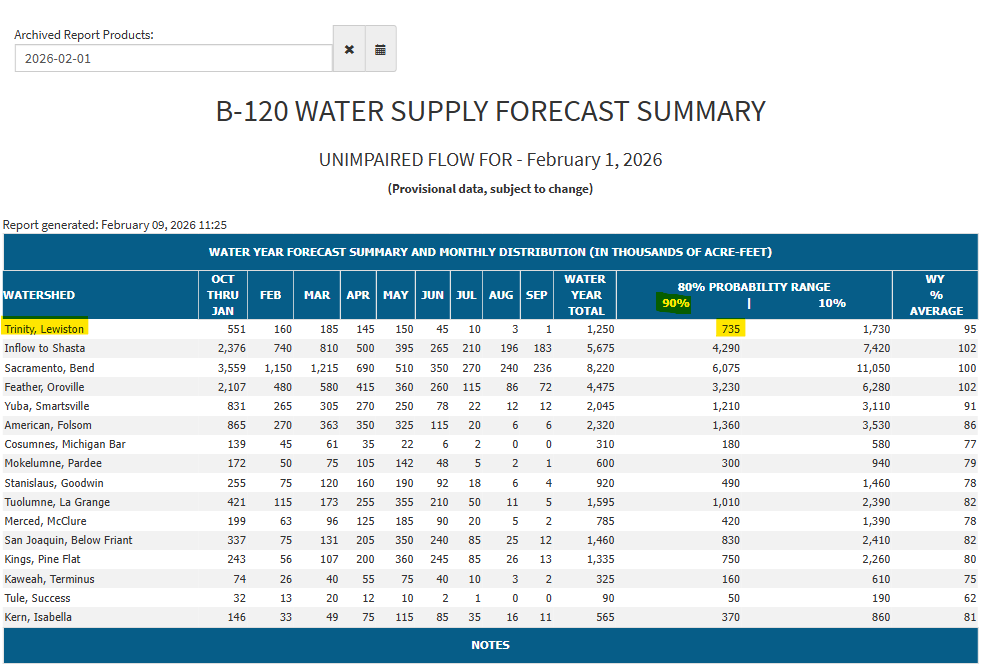
With a Feb. B120 determination of “Dry” or “Critically Dry” the Feb 15-Mar. 15 period will not increase releases to the Trinity River and Lewiston Dam flows will remain at 300 cfs (winter baseflow) until Mar. 15.
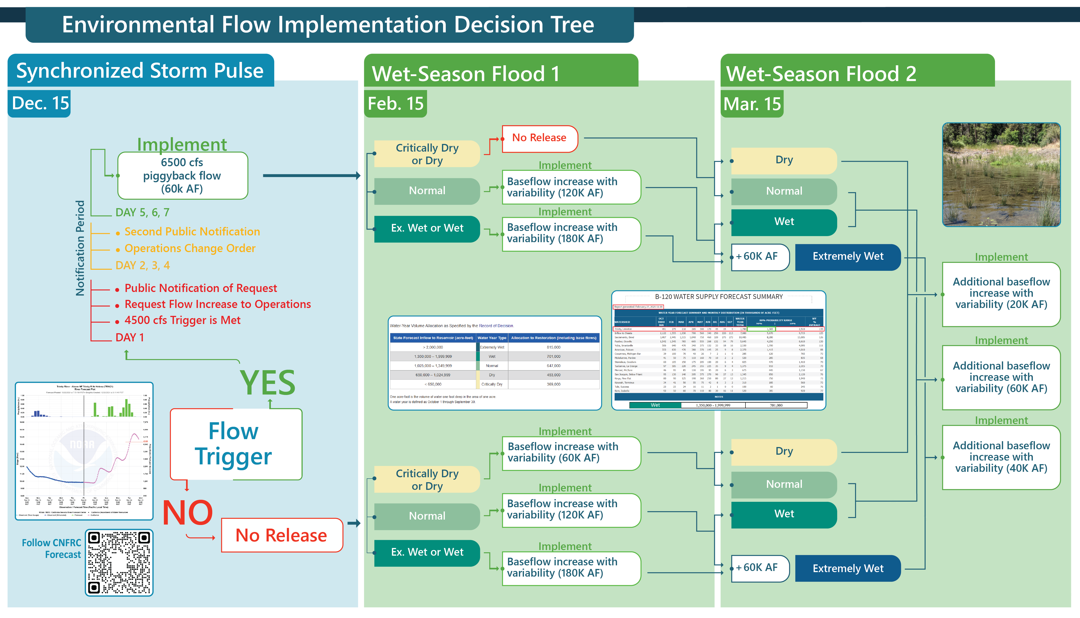
Prior to the next period (Apr. 15 – variable), the Program has a check-in on Mar. 15 to adjust flows based on the March 90% B120 declaration. In April, the Program implements a spring snow-melt and recession hydrograph following the final B120 water year determination by the Department of Water Resources.